Student-1st
Classroom fairness and engagement software for teachers
Ensure every student participates with measurable, provable data.
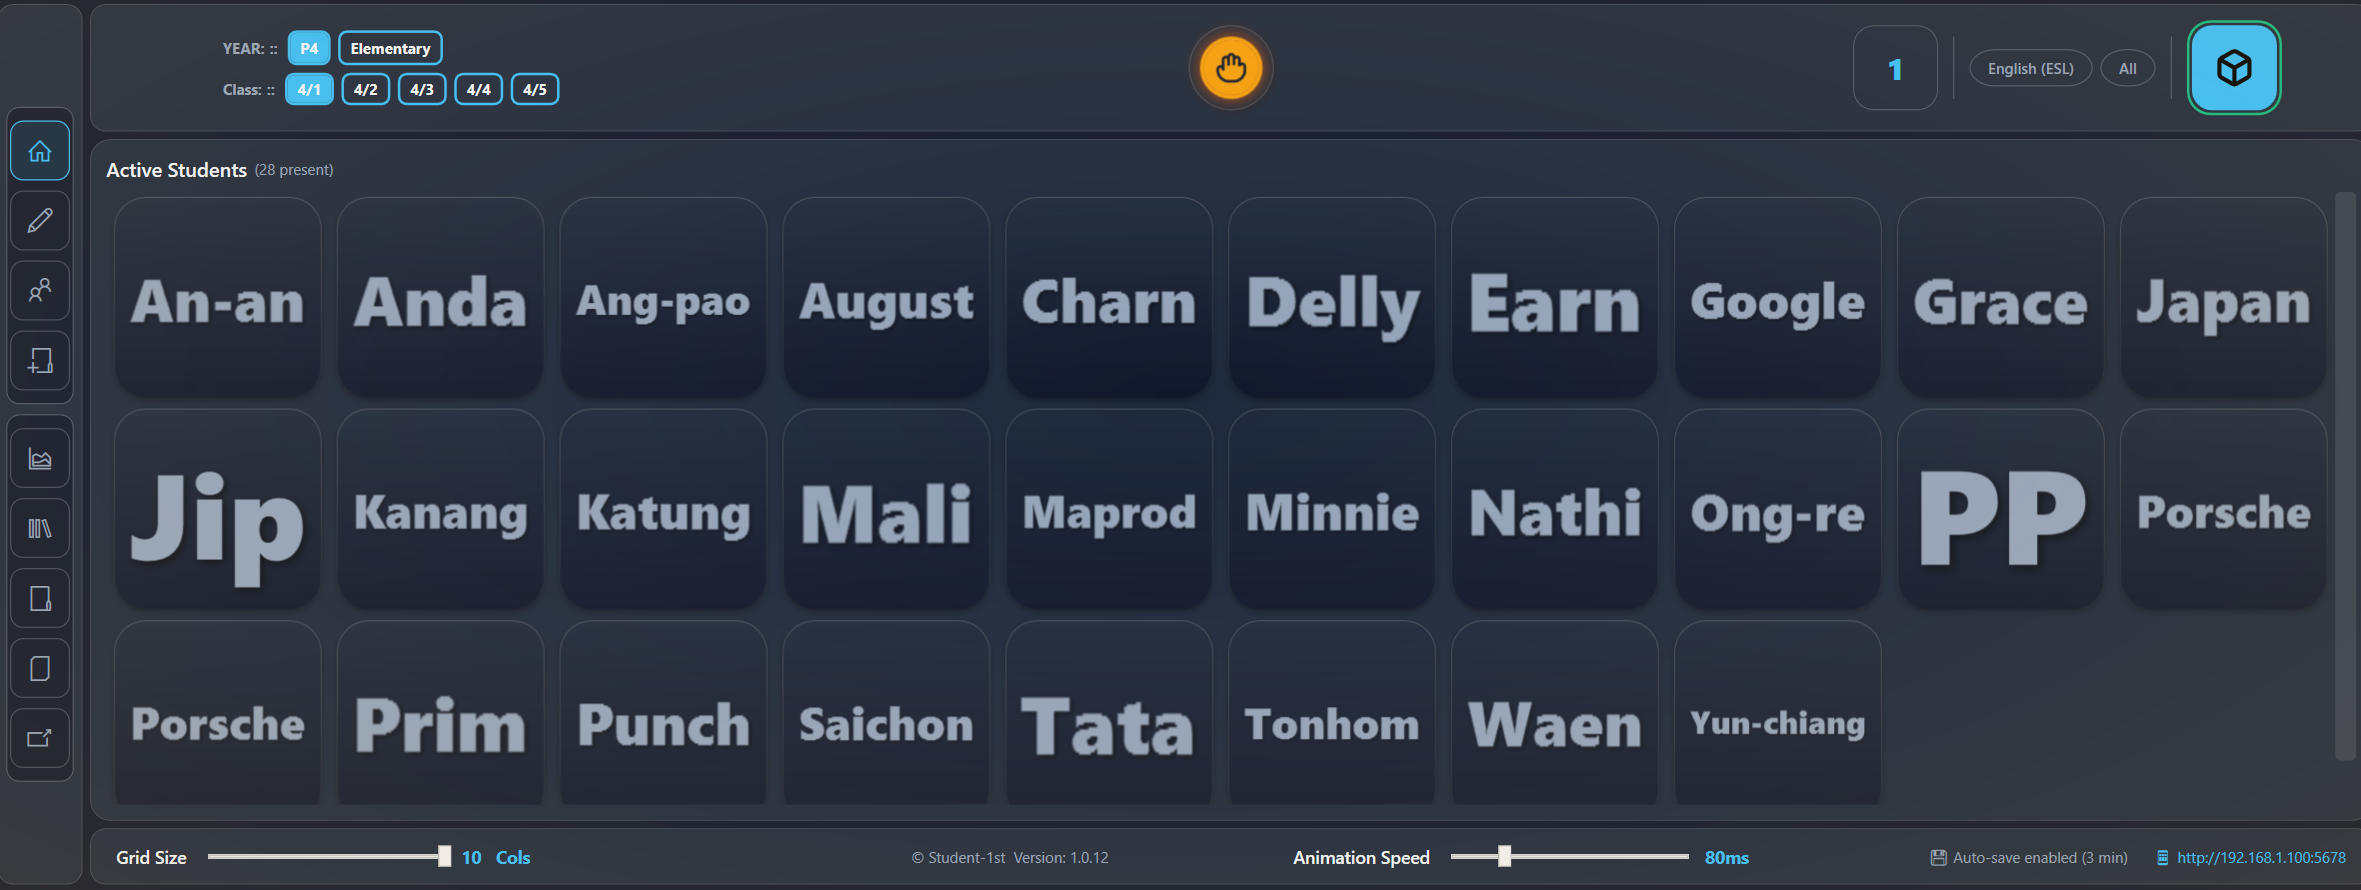
Student-1st tracks participation and guides who to call on next, so quieter and struggling students get the attention they need without slowing your lesson down.
Works Offline
WCAG 2.3.1 Compliant
Data-Driven Decisions
Built by a Teacher